在异常检测领域,尤其针对工业机械、核反应堆和网络安全等复杂系统,传统方法往往难以有效处理高维度且相互关联的数据流。多元状态估计技术(MSET) 与序贯概率比检验(SPRT) 的组合方法在此类场景中展现出显著优势。
MSET-SPRT 是一种结合机器学习状态估计与统计假设检验的混合技术框架,通过其高精度和稳健性,被广泛应用于关键任务系统的监控与分析。该方法能够实时识别系统行为的微小偏差,为预防性维护和异常事件预警提供可靠依据。

MSET-SPRT 理论基础
多元状态估计技术(MSET)原理
MSET 作为一种非参数非线性回归技术,通过历史观测数据构建系统正常状态模型。其核心工作机制包括:
建立包含历史正常系统状态的记忆矩阵,作为参考基准;利用学习到的历史状态间关系计算加权组合,从而估计当前系统的预期状态;通过对比观测值与估计值,计算系统行为偏差,为异常检测提供基础指标。
序贯概率比检验(SPRT)方法
SPRT 是一种基于统计推断的序贯假设检验方法,专用于确定系统行为偏差是否具有统计显著性。其主要功能为:
持续评估残差误差(实际观测值与模型估计值之间的差异),并根据预设的统计模型进行假设检验;当检测到的偏差超过统计置信阈值时,系统能够及时发出预警信号,同时控制虚警率在可接受范围内。
MSET-SPRT 框架通过上述两种技术的协同作用,为多元数据异常检测提供了准确且高效的解决方案,特别适用于高维度、高相关性的时间序列数据分析。
Python 实现 MSET-SPRT 异常检测
下面通过一个精简的示例来演示 MSET-SPRT 方法在 Python 中的实现过程。
导入必要的库
import numpy as np
import scipy.stats as stats
import matplotlib.pyplot as plt
生成模拟数据集
构建一个多元正态分布数据集,用于模拟正常运行状态下的系统行为:
## Simulating normal system behavior (3 correlated sensors)
np.random.seed(42)
mean = [50, 75, 100]  ## Mean values for three sensors
cov = [[10, 5, 2], [5, 15, 3], [2, 3, 20]]  ## Covariance matrix

## Generate 500 normal operation samples
normal_data = np.random.multivariate_normal(mean, cov, size=500)
实现 MSET 算法
采用基于加权最近邻的方法实现 MSET 算法,用于估计系统的预期行为:
class MSET:
    def __init__(self, memory_matrix):
        self.memory_matrix = memory_matrix  ## Store normal system states

    def estimate(self, input_vector):
        """
        Estimates the expected state based on historical data.
        Uses nearest neighbors to compute weighted estimation.
        """
        weights = np.exp(-np.linalg.norm(self.memory_matrix - input_vector, axis=1))
        weights /= np.sum(weights)
        return np.dot(weights, self.memory_matrix)
初始化 MSET 模型,将正常运行数据作为记忆矩阵:
## Initialize MSET with normal data as memory
mset_model = MSET(memory_matrix=normal_data)
计算残差
计算实际观测值与 MSET 估计值之间的残差,作为异常检测的基础:
## Simulated test data (normal + some anomalies)
test_data = np.vstack([
    np.random.multivariate_normal(mean, cov, size=450),  ## Normal
    np.random.multivariate_normal([70, 50, 130], cov, size=50)  ## Anomalies
])

## Compute estimated values
estimated_data = np.array([mset_model.estimate(x) for x in test_data])
## Compute residuals
residuals = np.linalg.norm(test_data - estimated_data, axis=1)
应用 SPRT 进行异常检测
基于似然比检验原理实现 SPRT 算法,用于判定残差是否表示异常状态:
## Define thresholds for SPRT
alpha = 0.05  ## False positive rate
beta = 0.05   ## False negative rate
mu_0, sigma_0 = np.mean(residuals[:450]), np.std(residuals[:450])  ## Normal behavior
mu_1 = mu_0 + 3 * sigma_0  ## Anomalous mean shift

## SPRT decision function
def sprt_test(residual):
    """ Sequential Probability Ratio Test for anomaly detection """
    likelihood_ratio = stats.norm(mu_1, sigma_0).pdf(residual) / stats.norm(mu_0, sigma_0).pdf(residual)
    return likelihood_ratio > (1 - beta) / alpha
## Apply SPRT
anomalies = np.array([sprt_test(res) for res in residuals])
## Plot results
plt.figure(figsize=(12, 5))
plt.plot(residuals, label="Residuals", color="blue")
plt.axhline(mu_1, color="red", linestyle="dashed", label="Anomaly Threshold")
plt.scatter(np.where(anomalies)[0], residuals[anomalies], color="red", label="Detected Anomalies", zorder=2)
plt.xlabel("Time")
plt.ylabel("Residual Magnitude")
plt.legend()
plt.title("MSET-SPRT Anomaly Detection")
plt.show()
结果分析与解释
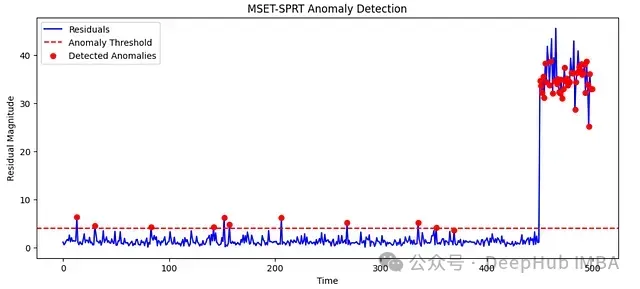
图中数据可视化结果展示了 MSET-SPRT 方法的异常检测效果:
蓝色曲线表示系统状态残差时间序列,反映了实际观测值与估计值之间的偏差大小;红色虚线标示出异常检测阈值,该阈值基于正常运行数据的统计特性计算得出;红色标记点则代表被 SPRT 算法判定为异常的时间点,这些点的残差值显著高于正常波动范围。
分析结果表明,MSET-SPRT 方法能够有效区分正常系统波动与异常行为,提供了一种可靠的多元时间序列异常检测方案。该方法特别适用于需要高精度异常检测的工业监控、设备健康管理和网络安全等领域。
https://avoid.overfit.cn/post/dc95da86cabf4ebb88e711bfa2196abc